|   Home   |   About   |   Projects   |    Tools   |   Art Educators |   Artists  |   Researchers   |  


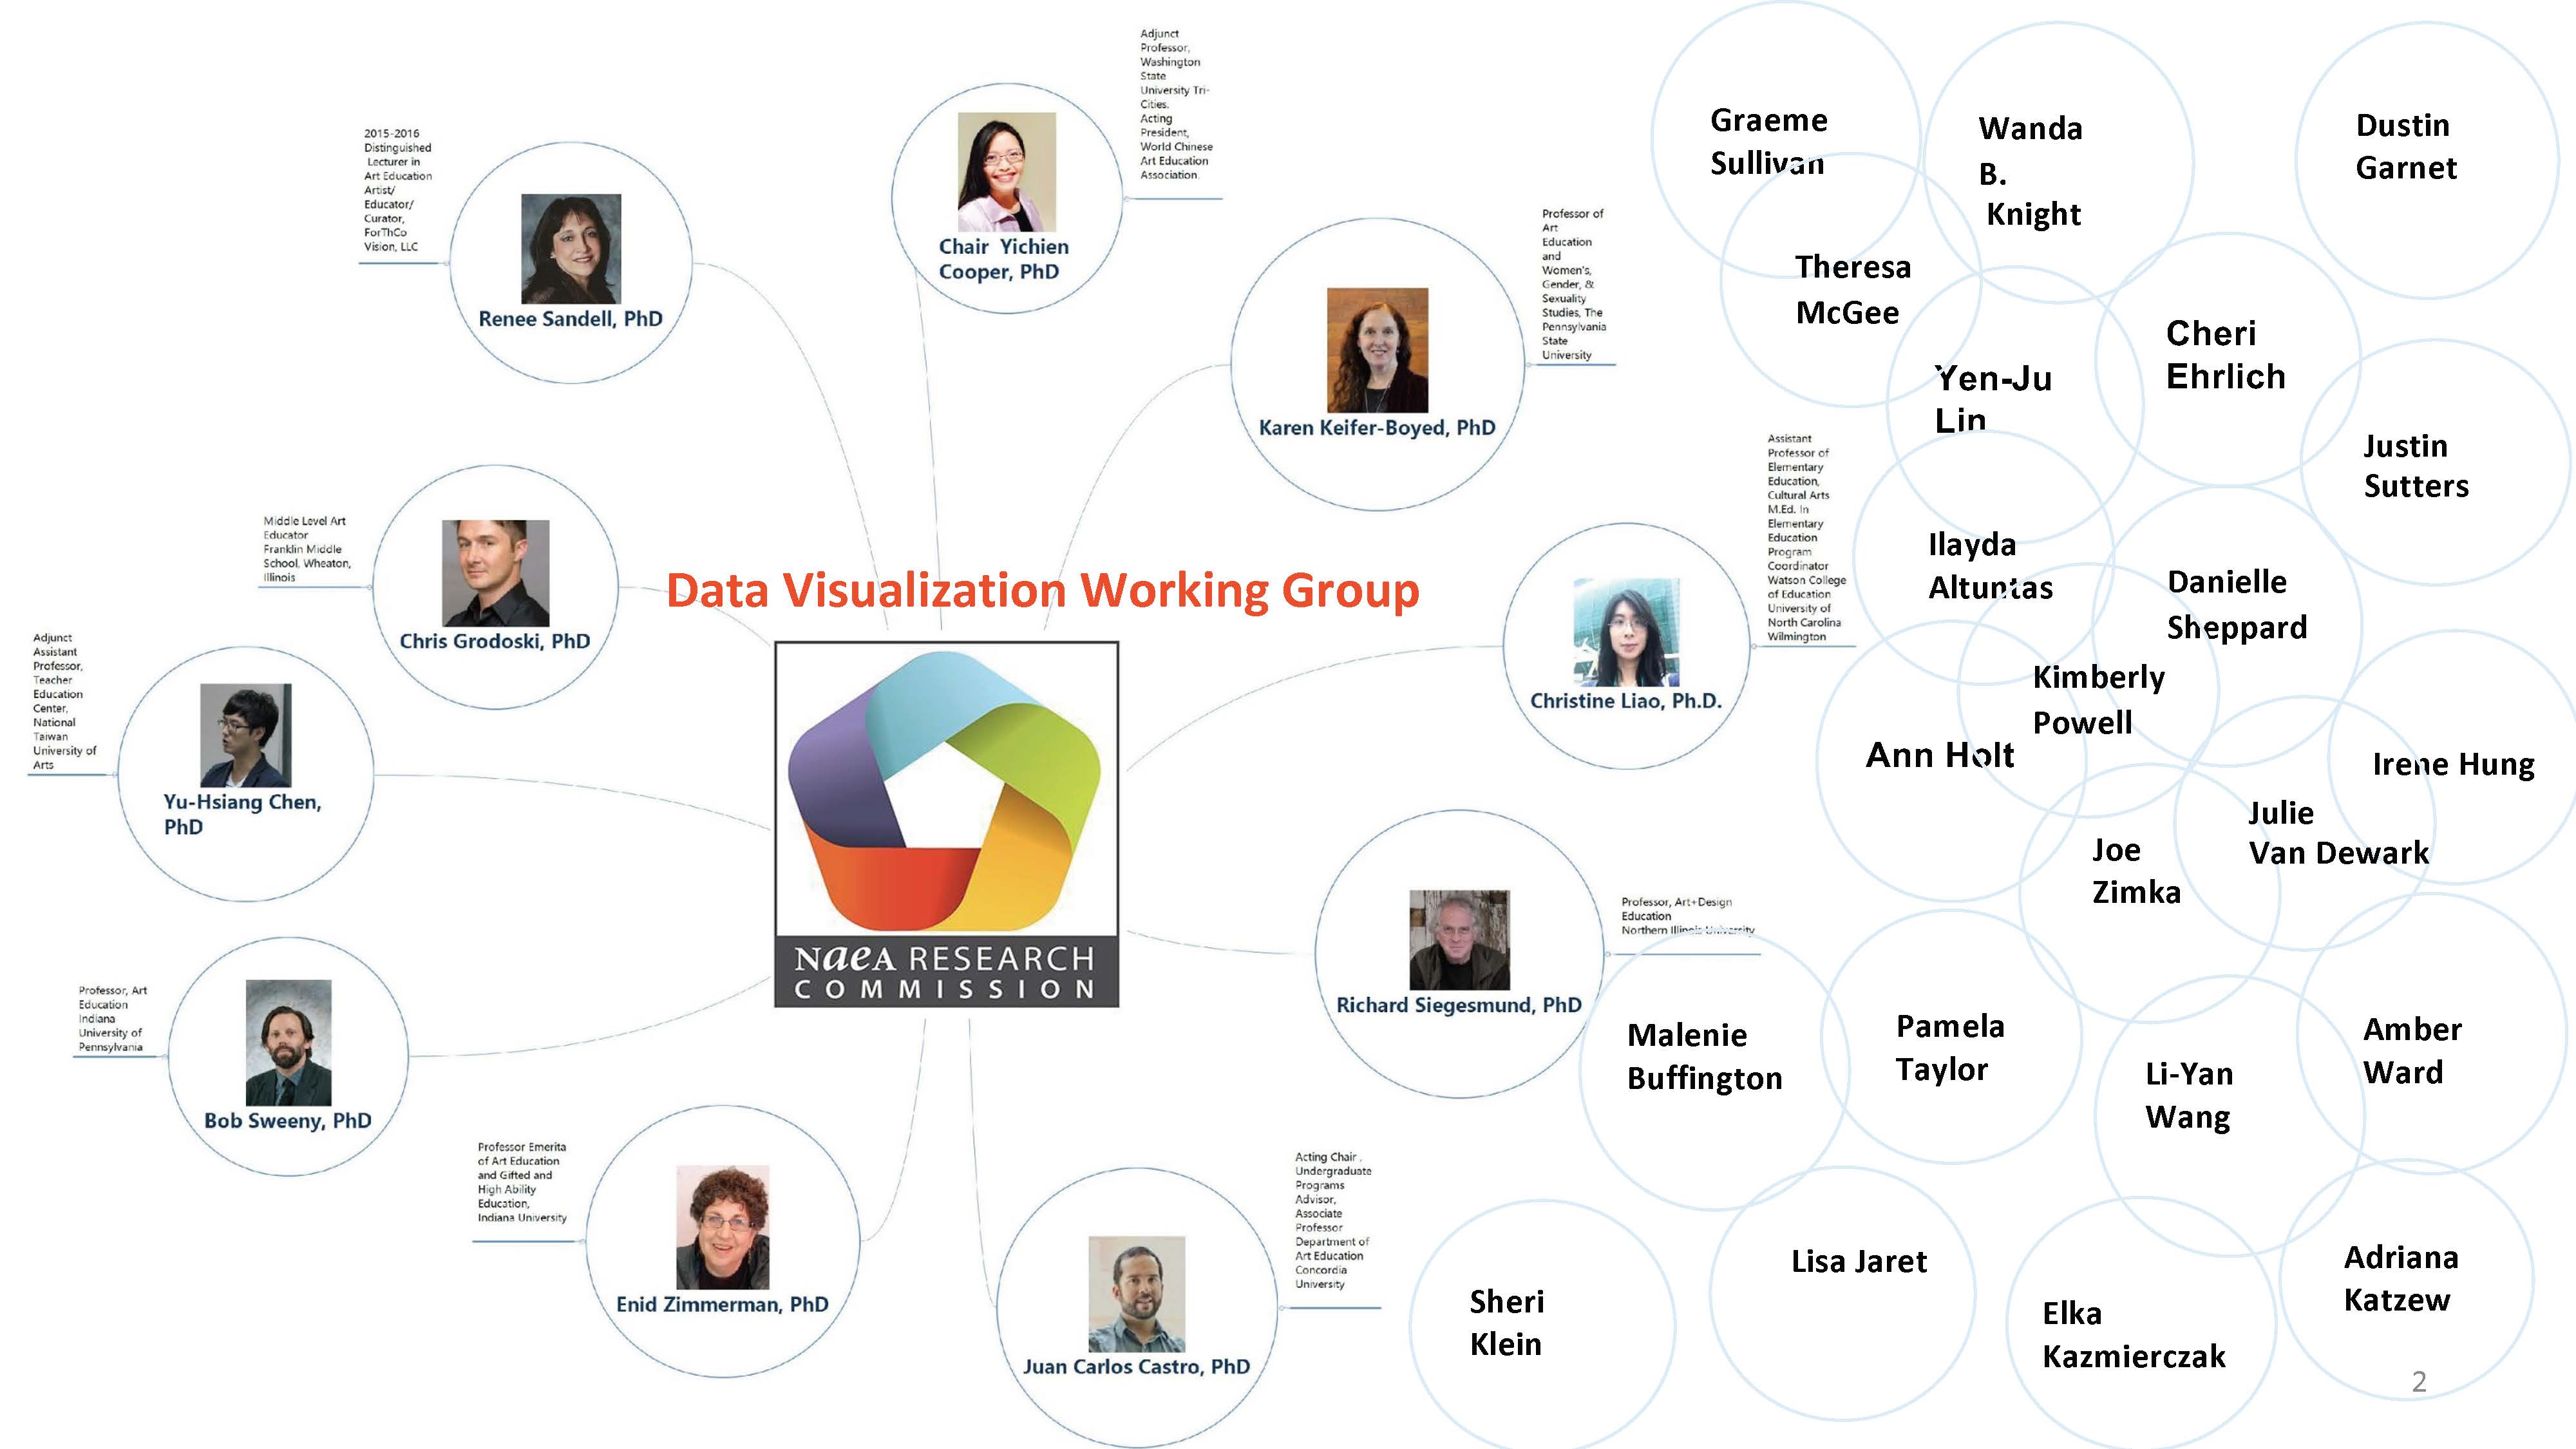
Welcome to the 2020 Data Visualization Working Group platform for sharing ideas, projects, examples, and resources.

The Data Visualization Working Group is endorsed by National Art Education Association’s (NAEA) Research Commission.

This website explores two questions:

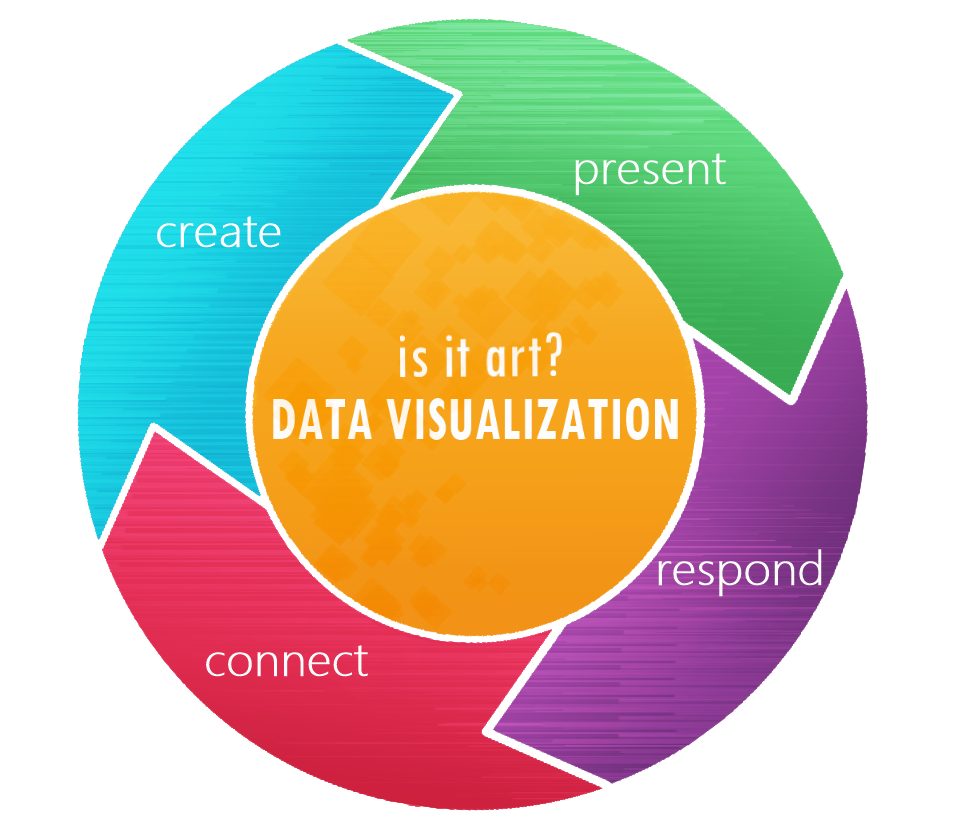
Is data visualization art?

How does data visualization align with the National Core Arts Standards?

The emerging site presents projects in alignment with the four pillars of the 2014 National Core Art Standards, namely,
Create, Present, Respond, and Connect.

Recognizing an increasing focus on the use of data in research and pedagogies within art education, the National Art Education Association Research Commission established the Data Visualization Working Group (DVWG) in 2012. Since then, DVWG members have used data visualization as a means to conduct researches and addressed topics such as: demographic data available from national surveys, student-teacher ratios, distribution of minority art teachers in the U.S., participatory research with field services,  as well as investigating art education policy and advocacy.

Data Visualization Working Group members have published research articles, English and Chinese chapters, hosted online events, and presentations and workshops. In all, the NAEA Research Commission’s Data Visualization Working Group shares approaches to and application of data visualization in art education research and teaching relevant to advocacy, scholarship, best practices, and future direction.