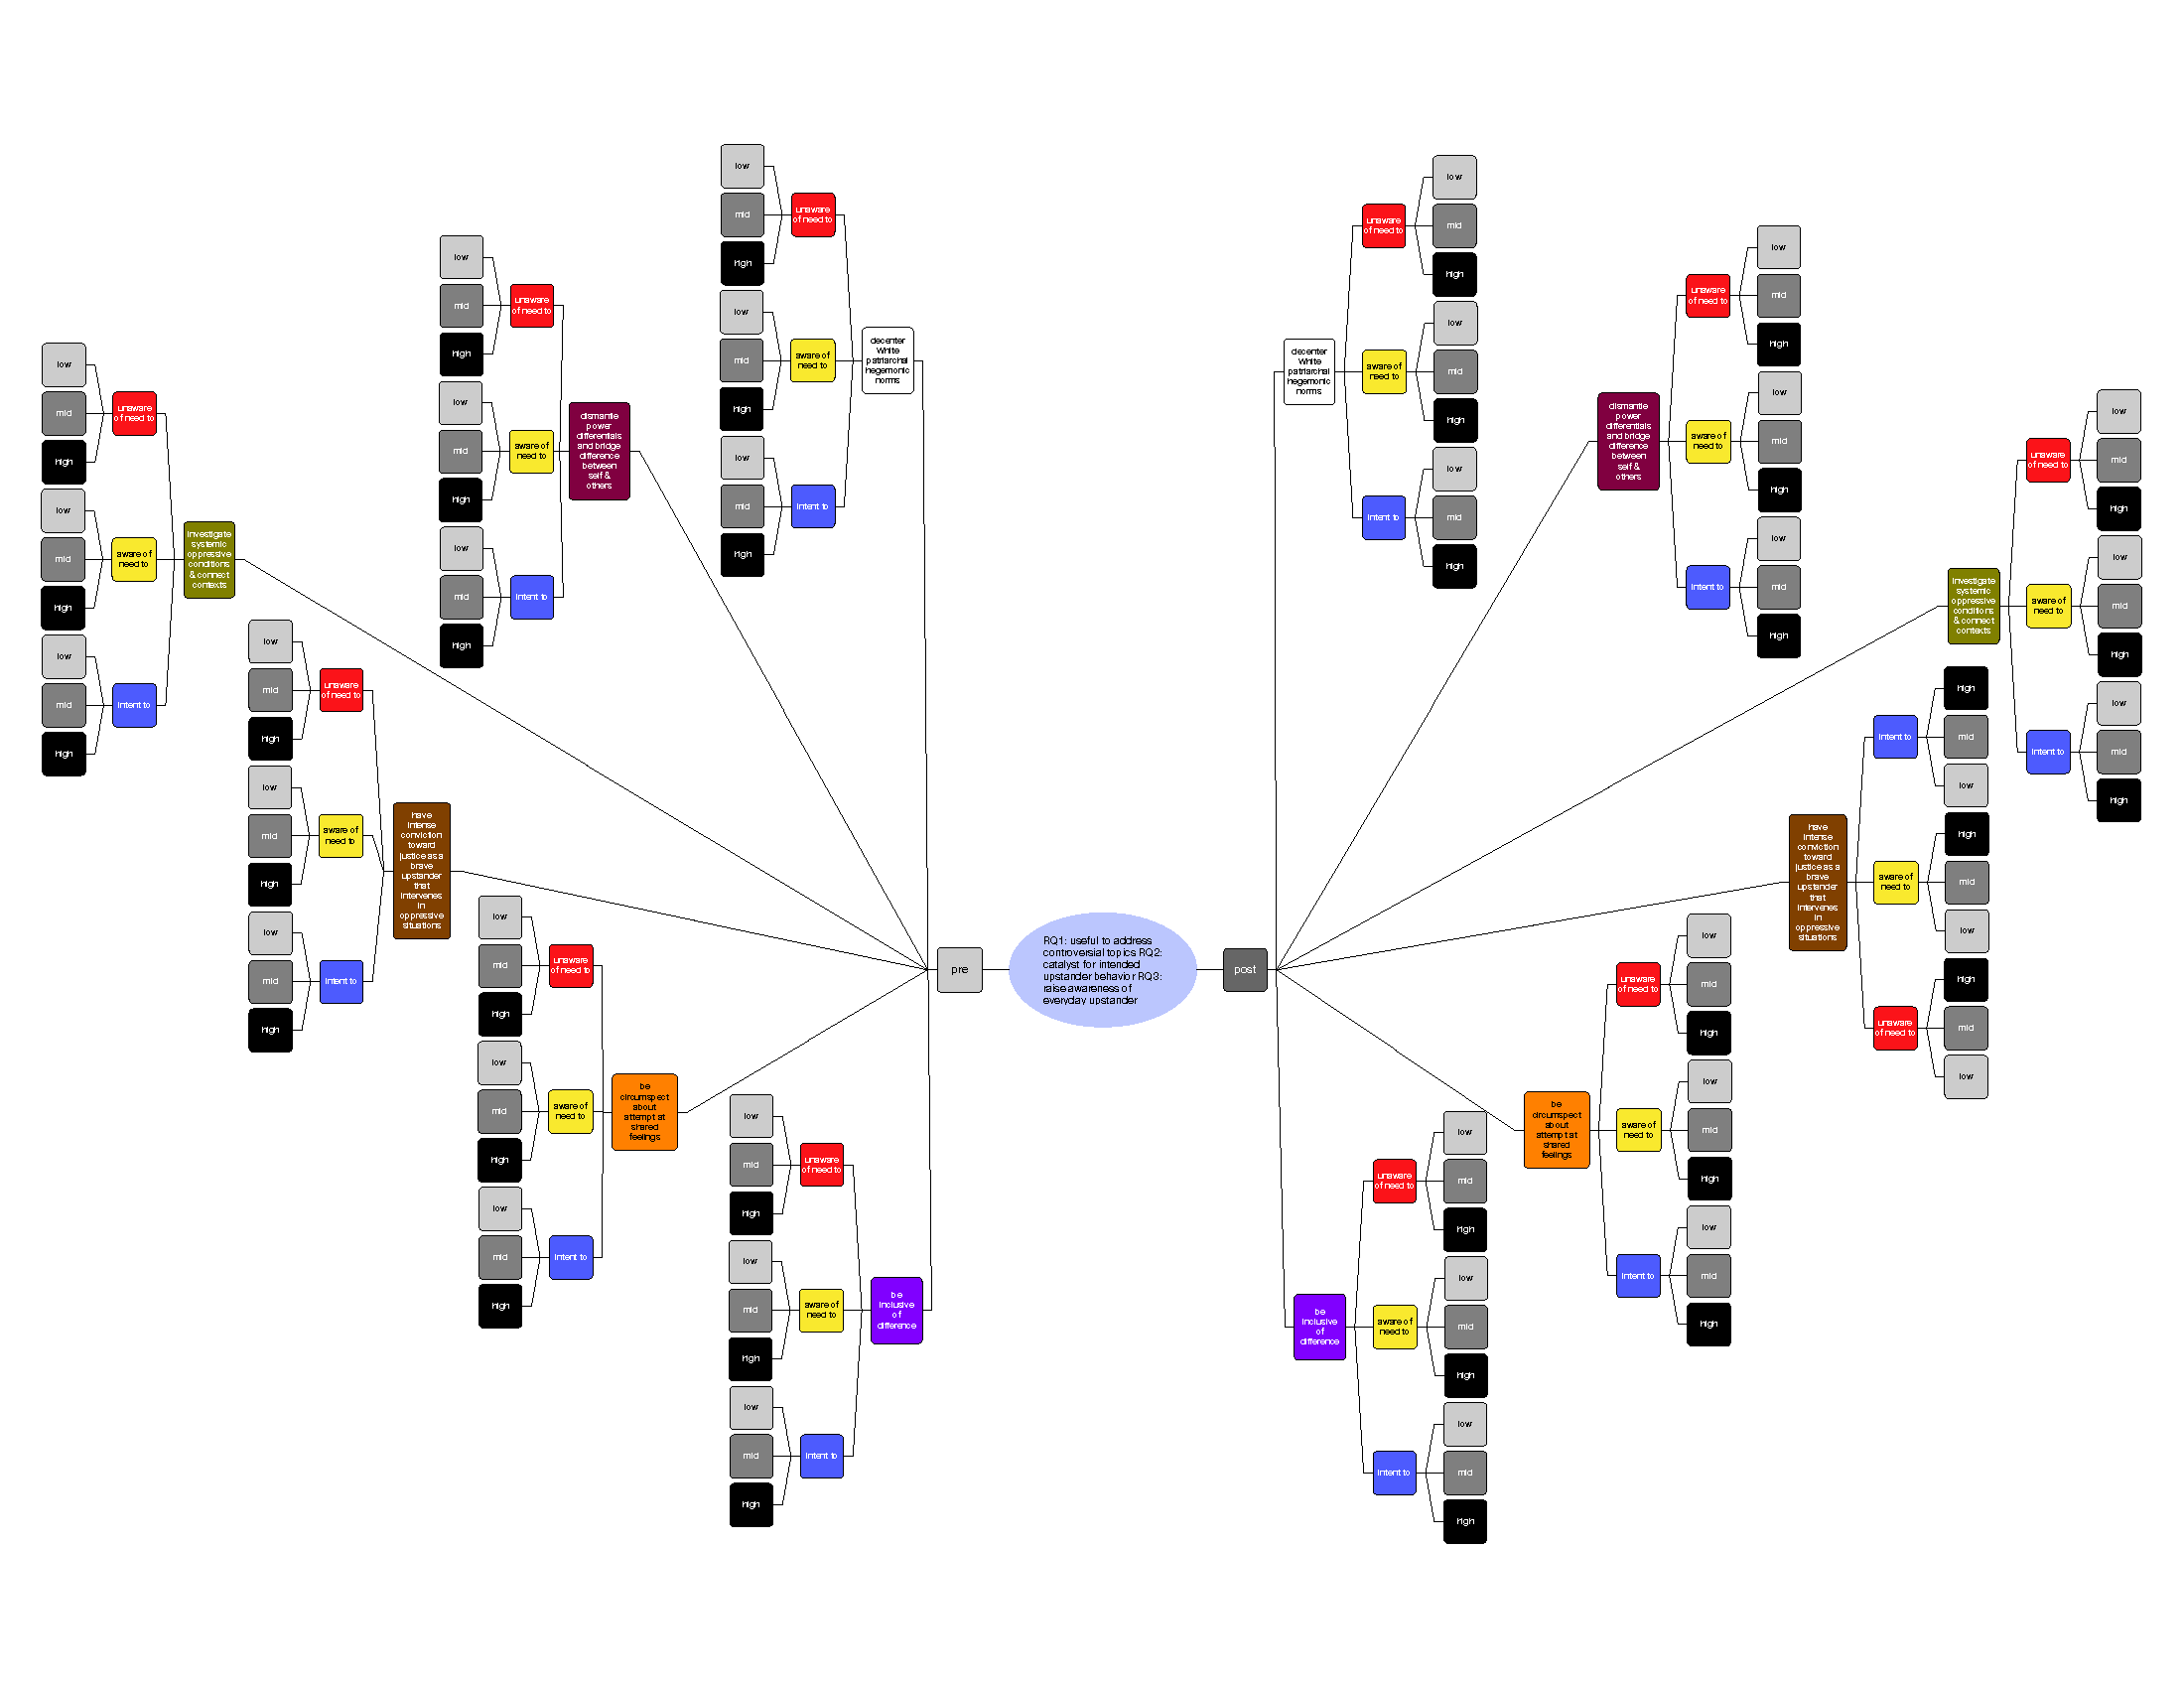
Data visualization is a broad term for numerous approaches to present information visually. Charts, graphs, and maps are common forms of data visualization. Artists and art educators have long known the power of visualization of ideas.
Data visualization can bring surprising new insights and be influential because large amounts of information are placed in relation to each other showing patterns and trends.
Yet the tool or apparatus—whether camera, paintbrush, or computer—entangles the subject with object, knower with known, and data with context.
Visualization of data sets is knowledge of the data in relationship with other things, people, and/or the environment.
From:
Keifer-Boyd, K. (in press). Interactive visualizations of relationships that matter. In A. Knochel, C. Liao & R. Patton (Eds.), Critical digital making. New York, NY: Peter Lang.