CALL-OUT to K-12 Art Teachers! Do you include data visualization projects in your classes? Data visualization is a broad term for numerous approaches to present information visually. Charts, graphs, and maps are common forms of data visualization. Artists and art educators have long known the power of visualization of ideas. Check out Nina Katchadourian’s art of charts and systems such as the Genealogy of a Supermarket. We are looking to compile approaches, projects, lessons, and examples from K-12 teachers as resources for NAEA members to be premiered at the April 9, 2020, 7;00-8:00 PM EST webinar, “Is it Art? Data Visualization: How does data visualization align with the National Core Art Standards?” We would love to hear from you! Please contact Yichien Cooper at yichiencooper@gmail.com and Karen Keifer-Boyd at kk-b@psu.edu 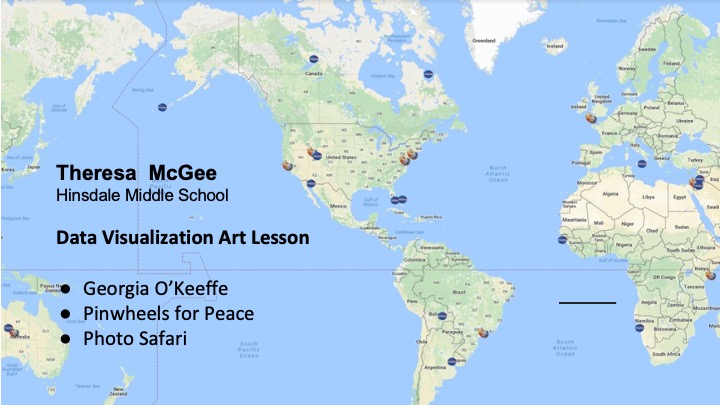 |
||
| Grade Level | Projects | Contributors |
| 1-2 | In teaching young children, you might introduce data with the common data visualization practice of placing birthday candles on a cake to convey the abstract notice of time with candles representing the number of years a person has existed. |
Julie Van Dewark |
| 3-4 | Inspired by Georgia Lupi and Stefanie Posavic's Dear Data project, elementary art school-teacher, Julie Van Dewark introduces data visualization with art lessons such as creating drawings of personal tracking of data such as food eaten on the weekend, and then extends from the personal to community to creating data visualizations of such prompts as the kinds of trees in the neighborhood. These are ideal art lessons during this time of remote teaching due to the global pandemic. |
Julie Van Dewark |
| 5-6 |
|
|
| 7-8 | Environmental Art Around the Earth: This map shows both the geographic location of environmental artists and satellite images depicting our world from space. Geographic location has a direct influence on art and artist creative ideas. In addition, capturing our earth as abstract art through satellite imagery reminds us of the urgent need to preserve its beauty. Georgia O'Keeffe Life Tour: Georgia's amazing life as a painter was directly influenced by her environment including her beginnings in Sun Prairie, WI, Chicago, later in Texas, then New York, and New Mexico. The invention of the Ford Model A (upgrade from model T) created the opportunity to travel through the rough terrain in the southwest, This accessibility, in turn, exposed O'Keeffe to much of our unseen earth's beauty allowing the world to see it through her eyes. |
Theresa McGee |
| 9-12 | Data Art Project: Presentation, Peer-critique | Nancy Long |
| 13-16 |
|
Karen Keifer-Boyd |